In working with field data, access alone is not enough. What truly matters is whether data can be quickly located, verified, and analyzed within the real-world context of an asset. Ayelix is designed to address exactly this challenge-by bridging structured data with spatial context and enabling a workflow that is both intuitive and engineering-driven.
One Environment for the entire asset
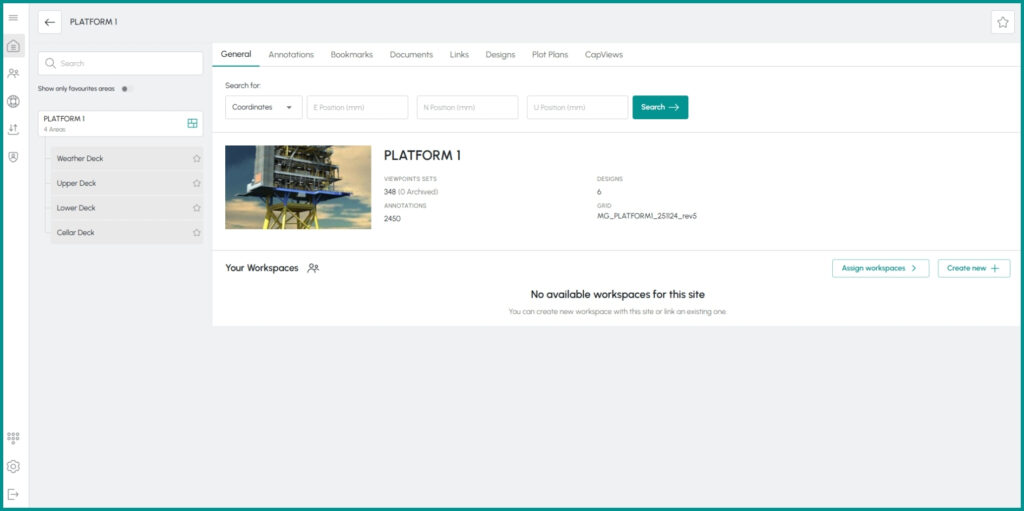
Every asset in Ayelix is organized into a structured environment that reflects its real-world layout—both logically and spatially.
Users operate within:
- clearly defined areas (e.g., different levels of a facility),
- connected documentation, designs and annotations,
- measurement data linked to specific locations.
This transforms the platform from a simple repository into a cohesive engineering data environment.
CapViews – the evolution of Survey Projects
The CapViews feature replaces the previous Survey Projects table, introducing a more advanced and flexible approach to handling measurement data.
While maintaining the original concept, CapViews extends it with:
- richer and more detailed data structures,
- stronger linkage to spatial locations,
- improved filtering and search capabilities.
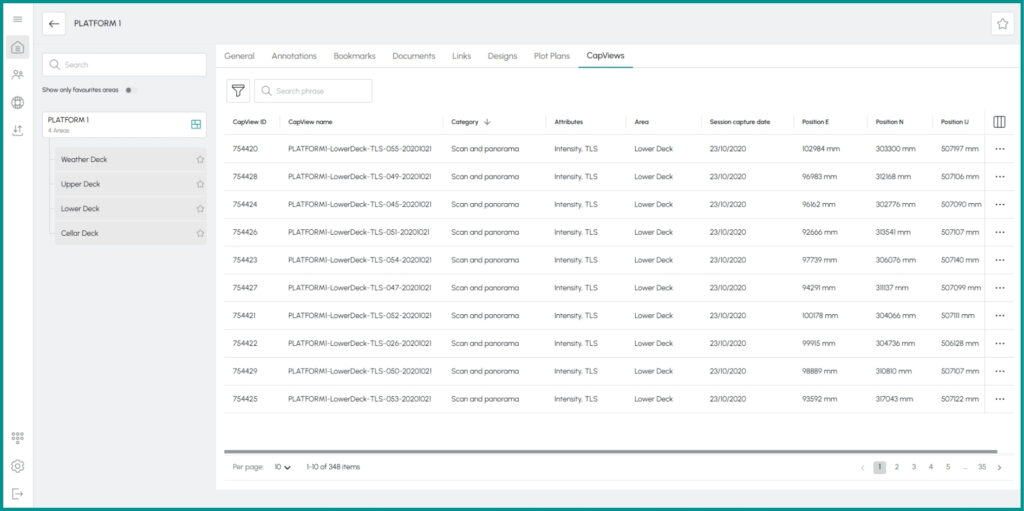
In its default view, CapViews provides a structured dataset with key measurement parameters:
| Field | Description |
| CapView ID | Unique identifier of the capture point |
| CapView Name | Name of the scan or panorama |
| Category | Type of data (e.g., scan, panorama, scanpanorama) |
| Attributes | Technical details (e.g., TLS, intensity) |
| Area | Assigned asset area (e.g., Lower Deck) |
| Capture Date | Date of the measurement session |
| Position (E, N, U) | Exact spatial coordinates |
Fast access to data and spatial context
Ayelix supports a streamlined approach to working with CapViews data, focused on fast access to spatial context.
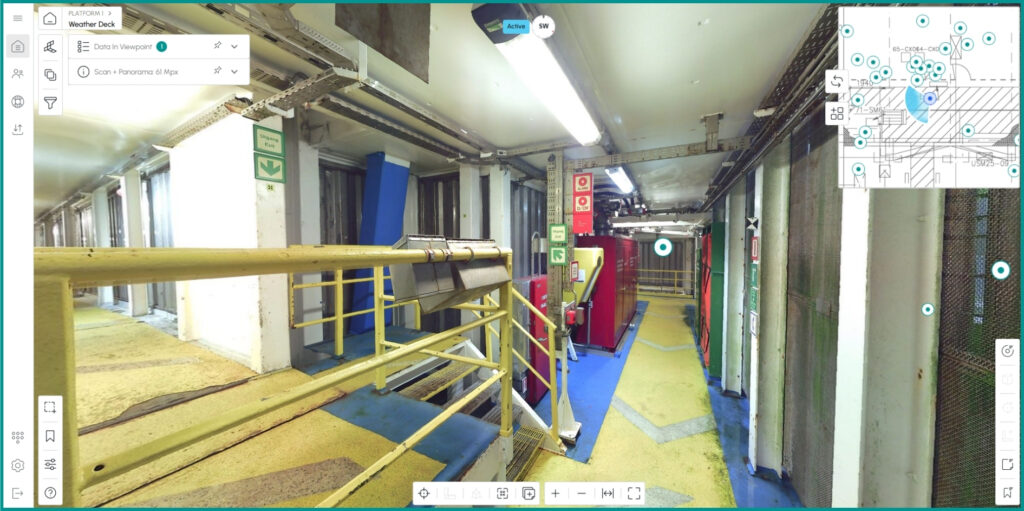
The Locate function enables immediate navigation from any table record directly to its exact position within the asset. With a single click, users are taken straight into the corresponding CapView, where the measurement can be explored in its real-world context.
This direct transition eliminates the need for manual navigation or interpretation of coordinates and allows users to move seamlessly from structured data to visual analysis.
As a result, users can:
- instantly access the correct location,
- analyze data within its spatial context,
- maintain continuity without interrupting their workflow.
Working without losing context
Engineering analysis rarely focuses on a single point. Efficient workflows require seamless navigation across multiple locations.
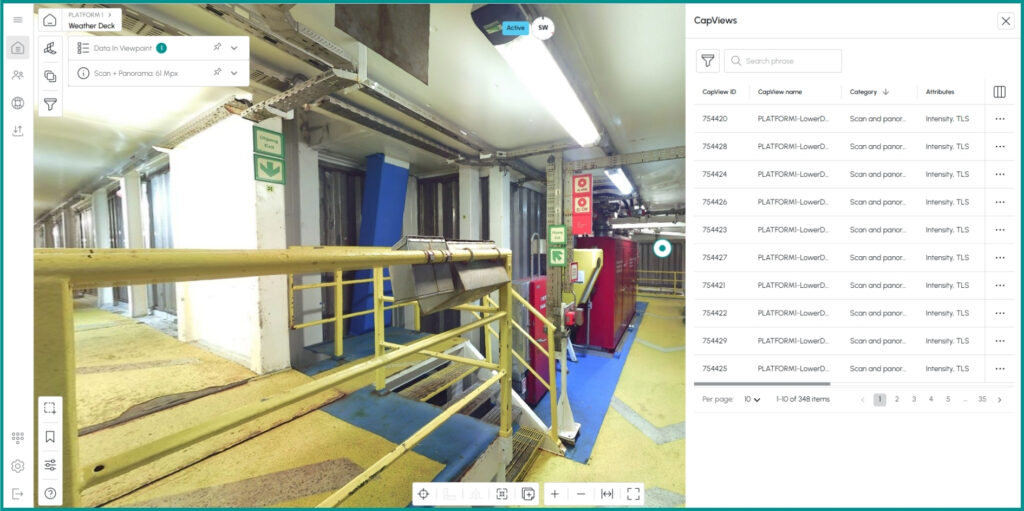
New CapViews icons within the viewer (bottom-right corner) allow users to open a side panel with a list of capture points and switch between them without leaving the current view.
This enables:
- uninterrupted analysis,
- faster navigation across locations,
- reduced interaction overhead.
Continuous improvement
We continuously strive to improve Ayelix by introducing new features and enhancing existing ones.
Our goal is to make working with Ayelix more efficient, faster, and easier in everyday use.